🌊💗 OceanHeart cmap
Here is a customized color map for python plot, I name it “OceanHeart” 🌊💗.
The color map is inspried by the animation of a Squirtle holding hearts.

Define the color map
1
2
3
4
5
6
7
8
9
10
11
12
13
14
15
import matplotlib.pyplot as plt
from matplotlib.colors import LinearSegmentedColormap

# Define the custom colormap with lighter blue and pink
colors = [(50/255, 88/255, 153/255),
          (101/255, 155/255, 200/255),
          (198/255, 216/255, 235/255),
          (245/255, 230/255, 235/255),
          (230/255, 178/255, 195/255),
          (240/255, 168/255, 185/255)]
n_bins = 100  # Discretizes the interpolation into bins
# Create the colormap
custom_cmap = LinearSegmentedColormap.from_list('OceanHeart', colors, N=n_bins)
# Register the colormap so it can be accessed with plt.get_cmap()
plt.register_cmap(name='OceanHeart', cmap=custom_cmap)
And visualize it: 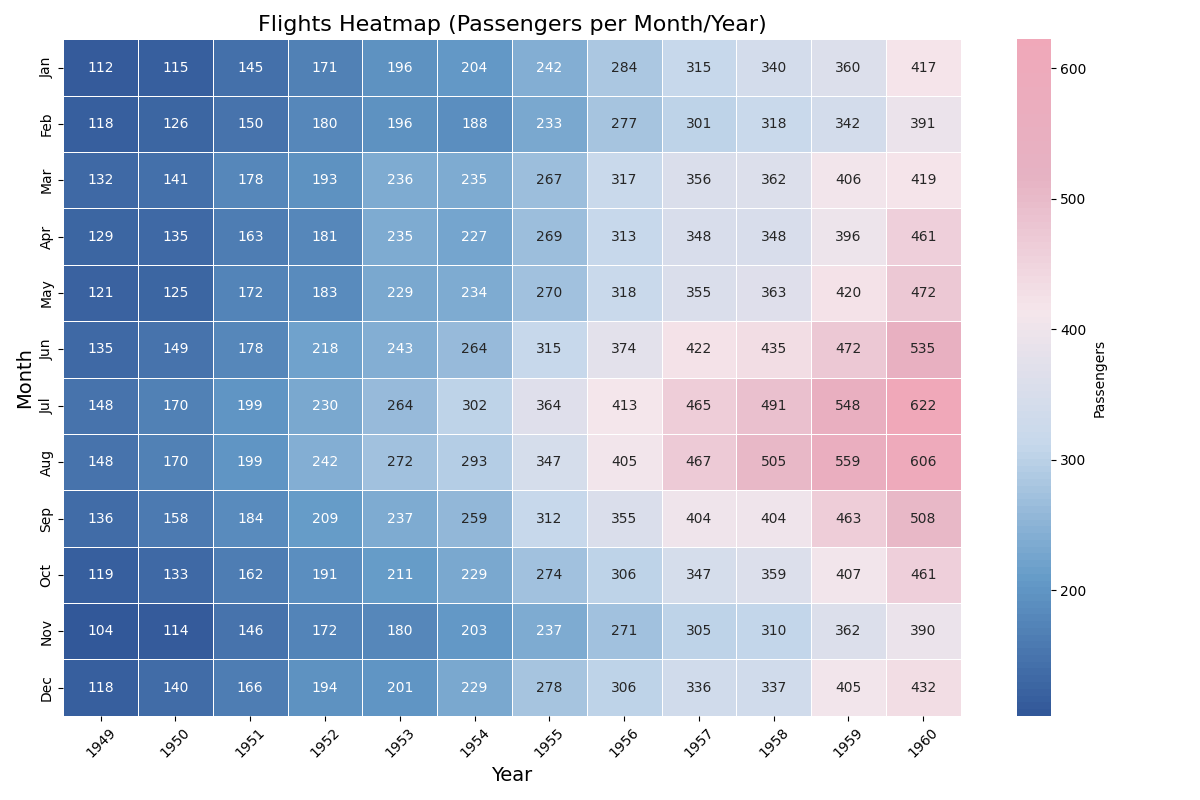
The code creating the above plot:
1
2
3
4
5
6
7
8
9
10
11
12
13
14
15
16
17
18
19
20
21
22
23
24
25
26
27
28
29
30
import seaborn as sns

def create_beautiful_heatmap():
    # Load the example flights dataset
    flights = sns.load_dataset("flights")
    # Pivot the dataset to create a matrix suitable for a heatmap
    flights_pivot = flights.pivot(index="month", columns="year", values="passengers")

    # Create a heatmap
    plt.figure(figsize=(12, 8))
    heatmap = sns.heatmap(flights_pivot, annot=True, fmt="d", cmap="OceanHeart", linewidths=.5,
                          cbar_kws={'label': 'Passengers'})

    # Customize the title and labels
    plt.title("Flights Heatmap (Passengers per Month/Year)", fontsize=16)
    plt.xlabel("Year", fontsize=14)
    plt.ylabel("Month", fontsize=14)

    # Rotate the x-axis labels for better readability
    plt.xticks(rotation=45)

    # Adjust the layout to fit everything nicely
    plt.tight_layout()

    # Show the plot
    plt.savefig('./OceanHeart_heat.png')
    plt.show()

# Call the function to display the heatmap
create_beautiful_heatmap()
This post is licensed under CC BY 4.0 by the author.