A line plot function
1
2
3
4
5
6
7
8
9
10
11
12
13
14
15
16
17
18
19
20
21
22
23
24
25
26
27
28
29
30
31
import numpy as np
import seaborn as sns
import matplotlib
matplotlib.use('TKAgg')
from matplotlib import pyplot as plt
def my_plot(data, legend, xtick, x_name='x', y_name='y', colors=sns.color_palette("Set2")):
x = np.array(list(range(data.shape[1])))
with sns.axes_style("darkgrid"):
figure, ax = plt.subplots(1, 1, figsize=[7, 5])
for i in range(data.shape[0]-1):
meanst = data[i, :]
plt.plot(x, meanst, c=colors[i], marker='o')
# specify color for threshold line
meanst = data[-1, :]
ax.plot(x, meanst, c=[0.7, 0.7, 0.7])
plt.ylabel(f'{y_name}')
plt.xlabel(f'{x_name}')
ax.set_xticklabels([''] + xtick)
plt.tight_layout()
ax.legend(legend)
plt.tight_layout()
plt.show()
Lets make up some data to plot:
1
2
3
4
5
6
7
8
9
10
11
12
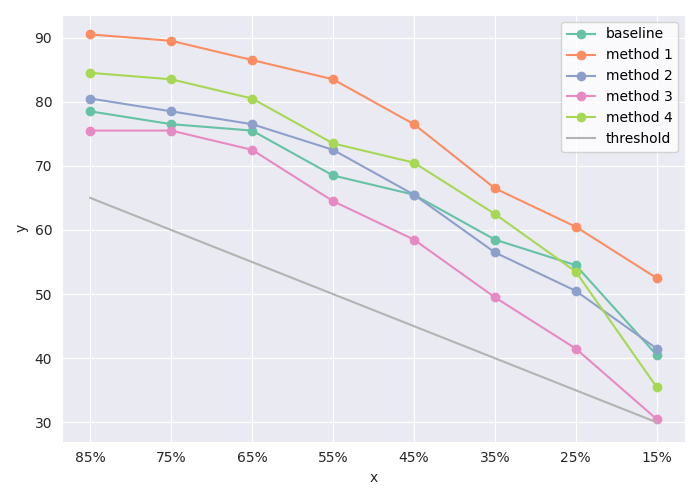
R = np.array([[78.5, 76.5, 75.5, 68.5, 65.5, 58.5, 54.5, 40.5],
[90.5, 89.5, 86.5, 83.5, 76.5, 66.5, 60.5, 52.5],
[80.5, 78.5, 76.5, 72.5, 65.5, 56.5, 50.5, 41.5],
[75.5, 75.5, 72.5, 64.5, 58.5, 49.5, 41.5, 30.5],
[84.5, 83.5, 80.5, 73.5, 70.5, 62.5, 53.5, 35.5],
[65, 60, 55, 50, 45, 40, 35, 30]])
print(f'Plot for {R.shape[0]} method')
methods = ['Baseline', 'Method 1', 'Method 2', 'Method 3', 'Method 4', 'threshold']
x = [f'{85 - 10*x}%' for x in range(10)]
my_plot(data=R, legend=methods, xtick=x)
The above code will generate a figure like this:
This post is licensed under CC BY 4.0 by the author.