Scatter plot demo Heart & Impulse
Here is a nice scatter plot function. It takes two arrays for the x and y axis of 2D points as input. The python script is available here: scatter plot.
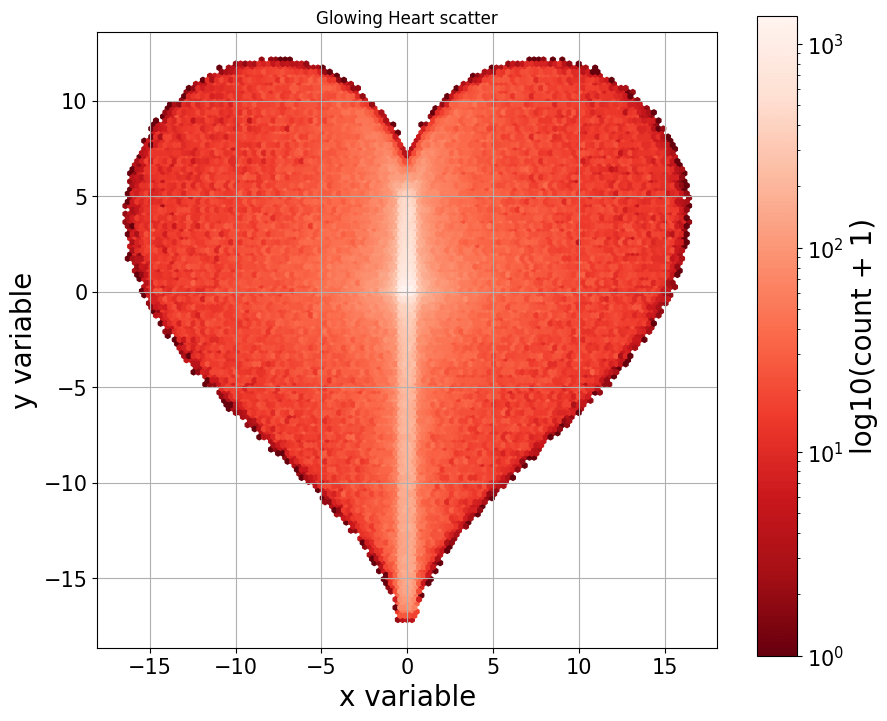
Here are two demos. Lets draw a heart using a heart shaped curve.
The code below plots a lovely heart:
1
2
3
4
5
6
7
8
9
10
11
12
13
14
15
16
17
18
19
20
21
def Radius_scatter(x, y, n_batch=10):
    s = np.random.random(x.shape[0])
    x_out = x * s + (np.random.random(x.shape[0])-0.5)
    y_out = y * s + 0.5 * (np.random.random(x.shape[0])-0.5)
    for i in range(n_batch):
        s = np.random.random(x.shape[0])
        x_temp = x * s + (np.random.random(x.shape[0])-0.5)
        y_temp = y * s + 0.5 * (np.random.random(x.shape[0])-0.5)
        x_out = np.concatenate((x_out, x_temp), axis=0)
        y_out = np.concatenate((y_out, y_temp), axis=0)

    return x_out, y_out

heart_x = lambda t: 16 * np.power(np.sin(t), 3)
heart_y = lambda t: 13 * np.cos(t) - 5 * np.cos(2 * t) - 2 * np.cos(3 * t) - np.cos(4 * t)
t = np.linspace(0, 2*np.pi, n_points)
x = heart_x(t)
y = heart_y(t)
x, y = Radius_scatter(x, y, n_batch=40)
scatter_plot(x, y, save_fp='./Heart.png', scatter_c='Reds_r', gridsize=120, title='Glowing Heart')
plt.show()
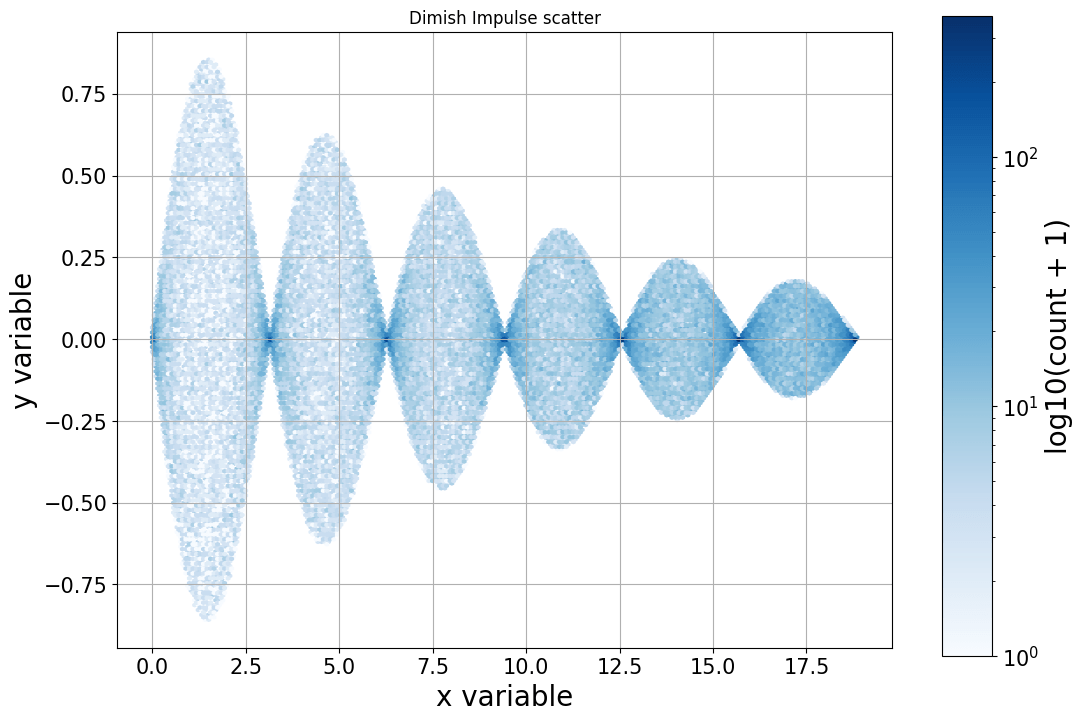
Another demo for a blue impluse pattern.
1
2
3
4
5
6
7
8
9
10
11
12
13
14
15
def Cartesian_scatter(x, y, n_batch=10):s
    x_out = x
    y_out = 2 * (np.random.random(x.shape[0]) - 0.5) * y
    for i in range(n_batch):
        y_temp = 2 * (np.random.random(x.shape[0]) - 0.5) * y
        x_out = np.concatenate((x_out, x), axis=0)
        y_out = np.concatenate((y_out, y_temp), axis=0)

    return x_out, y_out
dimish_impulse = lambda x: np.sin(x) * np.exp(-x/10)
x = np.linspace(0, 6*np.pi, n_points)
magnitude = dimish_impulse(x)
x, magnitude = Cartesian_scatter(x, magnitude)
scatter_plot(x, magnitude, save_fp='./Impulse.png', title='Dimish Impulse', figsize=(10, 8))
plt.show()
This post is licensed under CC BY 4.0 by the author.